
Nuclear radiation can be incredibly dangerous, but it can also be incredibly useful to us. The Shedding Light on Nuclear Radiation series teaches students what nuclear radiation is and how humans have harnessed its awesome power.
In Episode 10, Radiation Safety and Protection, we look at how much radiation dose humans typically receive from both natural and artificial sources of radiation and then explain the health issues that can arise when a person’s exposure to radiation is too high.
A 4½-minute excerpt followed by a 1-minute trailer.
Contents:
Part A: Introduction
Part B: Natural Background Radiation
Part C: Artificial Sources of Radiation
Part D: How Much Radiation is Too Much Radiation?
 The Episode 10 Question Sheet for Students:
![]() The PDF version.
The PDF version. ![]()
Google The Google Doc version. Google
Get the answers.
![]() If you have ClickView, watch the whole episode here.
If you have ClickView, watch the whole episode here.
![]() If you have Learn360, watch the whole episode here.
If you have Learn360, watch the whole episode here.
![]() If you have Classroom Video on Demand, watch the whole episode here.
If you have Classroom Video on Demand, watch the whole episode here.
![]() If you have Access Video on Demand, watch the whole episode here.
If you have Access Video on Demand, watch the whole episode here.
Transcript (More or Less)
 Part A: Introduction
Hi everyone. Welcome to another episode of the Shedding Light on Nuclear Radiation series. In this episode we’re going to look further into the concept of radiation dose which we started looking at in the previous episode.
 We’ve seen throughout the series that there are radioactive substances everywhere in nature. These substances expose us to what is called natural background radiation.
People can also receive radiation from for example certain medical procedures like CT scans or PET scans, or from exposure to nuclear materials in accidents such as the explosion of a nuclear reactor in Chernobyl in 1986.
So, what effective dose are we typically exposed to from all these sources of ionizing radiation and how dangerous is this exposure to our health? We’ll begin by taking a look at natural background radiation first. Since we’re all exposed to it, it makes a very good reference point to compare all other sources of radiation.
 Part B: Natural Background Radiation
The natural background radiation that we receive varies a lot around the world because there are so many factors at play.
In Australia, the average effective dose that we receive from natural background radiation is about 1.7 millisieverts per year or 1,700 microsieverts per year. I should explain that 1 Sv of effective dose is huge, so effective does is usually expressed in either millisieverts (where 1 sievert equals 1000 millisieverts), or microsieverts (where 1 sievert equals 1 million microsieverts). The English letter m stands for milli (1 thousandth) while the Greek letter that we call mu (![]() ), which is the way Greeks write the letter m, stands for micro (1 millionth).
), which is the way Greeks write the letter m, stands for micro (1 millionth).
 So these figures can be written in shortened form like this: 1.7 mSv/yr or 1,700
 ![]() Sv/yr. I’m going to use microsieverts from now on.
Sv/yr. I’m going to use microsieverts from now on.
So that’s for Australia. The average effective dose that people in the USA receive is about 3,000 microsieverts per year, in Canada it’s about 1,800, in England it’s about 2,700, but in Cornwall, England, a region in England’s southwest, it’s about 7,800 ![]() Sv/yr. The rocks there just happen to have more uranium and thorium than in most other places. The worldwide average is about 2,400 microsieverts per year. The variation comes down mostly to what kind of rocks we have underneath us.
Sv/yr. The rocks there just happen to have more uranium and thorium than in most other places. The worldwide average is about 2,400 microsieverts per year. The variation comes down mostly to what kind of rocks we have underneath us.
So, where does all the natural background radiation come from. Well, let’s look at the figures in Australia.
 Of the 1700
 ![]() Sv per year that people living in Australia receive on average from natural sources of radiation, about 600
Sv per year that people living in Australia receive on average from natural sources of radiation, about 600 ![]() Sv comes from radioactive substances in the ground (which is called terrestrial radiation), about 500
Sv comes from radioactive substances in the ground (which is called terrestrial radiation), about 500 ![]() Sv comes from the gas radon and its decay products that we inhale into our lungs, 300
Sv comes from the gas radon and its decay products that we inhale into our lungs, 300 ![]() Sv comes from cosmic radiation, about 200
Sv comes from cosmic radiation, about 200 ![]() Sv comes from potassium-40 that is in our bodies, and about 100
Sv comes from potassium-40 that is in our bodies, and about 100 ![]() Sv comes from uranium and thorium in our bodies. Let’s look briefly at each of these, starting with terrestrial radiation.
Sv comes from uranium and thorium in our bodies. Let’s look briefly at each of these, starting with terrestrial radiation.
 Rocks, dirt, and clay all contain small amounts of radioactive substances like uranium, thorium, and potassium-40. On average, every tonne of the Earth’s crust contains about 10 grams of thorium, about 3 grams of uranium and about 3 grams of potassium-40.
Remember, all isotopes of uranium and thorium are radioactive, but most of the potassium on Earth is not radioactive, only the potassium-40 isotope is.
These figures can be expressed as 10 parts per million by weight and 3 parts per million by weight.
It seems a small amount but there’s an awful lot of crust underneath us so we’re actually talking huge quantities overall and some of the radiation that these radioactive substances emit ends up hitting us. Added to that all the radioactive daughter nuclei, here I’m showing the decay chain of thorium-232, also emit radiation and some of that radiation hits us as well. All up, radiation from the ground AND of course from all the concrete or bricks or stones or other building materials that are made from stuff we find in the ground gives us an effective dose of about 600 microsieverts per year.
Let’s look at radon and its decay products.


 The decay chains of uranium-235, uranium-238, and thorium-232, each contain an isotope of radon, all of which are alpha and gamma emitters. Radon is of particular interest because it’s a gas.
So, as soon as it forms, it doesn’t necessarily stay where it is. Though a lot gets trapped inside the rock or concrete or brick where it forms, some leaks out into our homes or workplaces.
We then literally inhale it into our lungs where it then blasts our lungs from the inside with alpha particles.
Now not only is it a gas, it’s a Group 18 gas, which means it doesn’t chemically react with anything, so this makes it even more likely to leak out into the atmosphere where we can breathe it in.
The radioisotopes that are produced by radon’s decay aren’t gases, but the atoms often stick to dust and so we often inhale them in as well.
 Thanks to the fact that radon and many of its decay products are alpha emitters, AND that they have fairly short half-lives, AND that the alpha particles get emitted inside our bodies, they do a lot of damage. Radon and its decay products are the second biggest cause of lung cancer, behind smoking.
So, though the effective dose is an average of about 500 microsieverts a year, this figure is misleading because if you live in a poorly ventilated building with concrete or brick walls, the radon levels are much higher than average and so the effective dose you’ll receive is also much higher. Ventilating the interior spaces however, reduces any risk enormously.
At 300 microsieverts per year, cosmic radiation is the third biggest source of natural radiation that we receive. It’s made of cosmic rays and the showers of cosmogenic particles that are produced by them. We’ve looked at cosmic rays quite a lot in previous episodes. Most are absorbed by the atmosphere, but some make it all the way down to the Earth’s surface.
The next major contributor to our average effective dose is the radiation that we receive from potassium-40 and from all the isotopes of uranium and thorium that are right now inside our bodies. They got inside us because they were either in our food or in our water.
 As I said before, these radioactive substances are very widespread in nature. Plants absorb tiny amounts of them out of the soil and they end up inside us either when we eat the plants or when we eat the animals that eat the plants. The biggest single contributor is potassium-40 (which by the way is a beta-minus emitter). Now potassium makes up about 2% of the Earth’s crust (by weight) if you include all its isotopes and it’s an essential nutrient that all plants and animals, and humans, need. However, 0.01% of all potassium on Earth is potassium-40. Plants absorb it just like they do the stable isotopes of potassium, and it ends up inside us.
 I weigh about 80 kg and there’s about 160 grams of potassium in my body. Of that 160 grams, about 0.01% is potassium-40 which comes out to about 16 milligrams, that is 16 thousandths of a gram. The activity of the potassium-40 in my body is about 4,000 Bq, that is, 4000 decays per second, which is giving me an effective dose of about 200 microsieverts per year.
Meanwhile, uranium and thorium in our bodies contribute 100 microsieverts per year. Remember, all these figures are averages for people living in Australia but, as we saw before, they’re kind of… fairly similar everywhere on Earth. If I included more examples, they wouldn’t be very different to these figures.
There is nothing we can do to avoid all the natural background radiation that’s all around us, except maybe to ensure that you ventilate your home so that radon doesn’t build up too much. Natural background radiation is everywhere. You can’t escape it on Earth, and you can’t escape it in space because in space you might get less terrestrial radiation but you’ll get more cosmic radiation. In fact, there’s more cosmic radiation in space than there is terrestrial radiation on Earth.
Now these figures are a good reference point for understanding the effective dose that we’ll receive if we undergo any kind of procedure that involves ionizing radiation, like a PET scan, for example or if we work in any industry where ionizing radiation is present.
So, let’s look at some examples of the effective radiation dose we receive from artificial sources of radiation.
 Part C: Artificial Sources of Radiation:
So, the effective dose from natural sources of radiation in Australia is about 1,700 microsieverts/year. If we divide this by 365, the number of days in a year, we get about 4.7 microsieverts per day which I’m going to round off and just say about 5 microsieverts per day. But how much effective dose do we receive from different medical procedures that expose us to ionizing radiation? Well, let me draw up a table and give a few examples. A dental X-ray gives an approximate effective dose of about 5 microsieverts. Given that we receive about 5 microsieverts per day from natural background radiation anyway, 5 microsieverts from the X-ray equates to about 1 day’s worth of natural background radiation. So, let me create a third column, Time Comparison to Average Australian Natural Background Radiation Dose and put in the figure of 1 day.
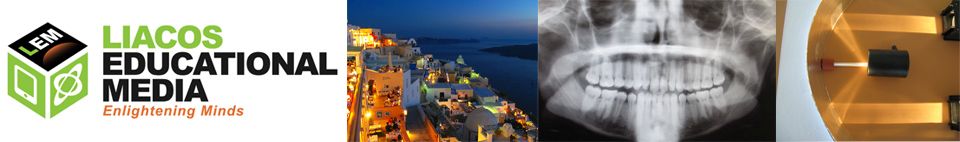
 An OPG dental X-ray (which scans all of a patient’s teeth) gives an effective dose of about 25 microsieverts. This is about the same as about 5 days’ worth of natural background radiation. A chest X-ray gives an effective dose of about 100 microsieverts, which is about 20 days’ worth of natural background radiation. So, the effective dose of normal X-rays is pretty small. However, CT scans, which also use X-rays, give a much larger effective dose. A CT brain scan delivers an effective dose of about 1,600 microsieverts which is about 11 months’ worth of natural background radiation. CT scans produce a 3D image by taking a large number of X-ray photos, after which a computer puts them all together. The effective dose is larger, but if a patient has serious life-threatening issues and doctors need to find the problem, then it’s usually a good idea to go ahead and get one.
Now thyroid scans which are used to diagnose thyroid cancer require the injection of iodine-123, a gamma emitter. The effective dose is about 740 microsieverts which is about 3 months’ worth of background radiation. Finally, a typical PET scan using FDG made with radioactive fluorine-18 delivers an effective dose of about 12,000 microsieverts. This equates to about 7 years’ worth of natural background radiation.
 In Australia, the Australian Radiation Protection and Nuclear Safety Agency, an Australian Government agency, overlooks all radiation matters relating to the general public and to industry. Laws have been enacted to ensure that exposure to ionizing radiation is limited.
The current limits are 1,000 microsieverts per year for the general public (that is 1000 microsieverts over and above the natural background radiation) and 20,000 microsieverts per year for workers who may be exposed to ionizing radiation in their jobs.
Anyone who works in any industry where ionizing radiation is involved has to wear what’s called a dosimeter. This measures the worker’s effective radiation dose and can quickly warn everyone if there’s been a radiation leak of some sort.

 To help reduce exposure, people who have to have an X-ray for example, are often given a lead-lined apron to put on. The lead doesn’t allow X-rays to pass through it, so it reduces the exposure of X-rays to the parts of the body that the doctor or dentist is not interested in. The person who sets up the X-ray camera or machine will always leave the room so that he or she is not exposed to X-rays unnecessarily. Whenever ionizing radiation is around, shielding is always put into place to minimize exposure.
 The principal guidelines boil down to ensuring that any radiation exposure does more good than harm and that radiation exposure is kept as low as reasonably achievable, which has been turned into an acronym: ALARA. Radiation exposure should always be kept as low as reasonably achievable.
So, let’s now look at how much ionizing radiation we can be exposed to before our health is definitely affected.
Part D: How Much Radiation is Too Much Nuclear Radiation?
For the vast majority of us, exposure to nuclear radiation doesn’t reach anywhere near dangerous levels. Natural background radiation is quite small and varies a lot around the world anyway, so getting an occasional X-ray is simply not an issue.

However, 10s of millions of people around the world work in industries where they are exposed to higher levels of radiation than average: hospital workers who work with radioisotopes for example. What effective dose increases their chance of getting cancer down the track, or being harmed in some other way? Well, the question is really hard to answer because cancer is fairly common anyway, so trying to determine if a person’s exposure to radiation caused cancer or if the cancer was caused by some other factor is very difficult. Smoking and being very overweight, for example, increase the chances of getting cancer enormously.
However, we can get an idea of how much harm is done by looking at examples.
I can draw a simple Effective Dose number line using what’s called a logarithmic scale to illustrate potential harm. Since effective doses can vary enormously, a logarithmic scale allows us to illustrate a very wide range. The scale goes up from 1, to 10, to 100 and so on, with each division being ten times greater than the previous division.
 I can put in the average natural background radiation in Australia of 1,700 microsieverts per year, and the worldwide average of about 2,400 microsieverts per year. These are low doses and our bodies are actually pretty good at repairing any damage that low-level radiation causes. There is no evidence that these doses are harmful, and as I said earlier, there’s not much we can do to reduce our exposure anyway.
It turns out that there’s no evidence of harmful effects for effective doses of up to about 100,000 microsieverts of ionizing radiation. After that there is definite evidence that there is an increase in cancer risk, and above about a million microsieverts, radiation can cause radiation sickness or death.
However, these are only very approximate figures because there will be more harm if the radiation received is received over a shorter period of time.
So how do we know all this? Well, we’ve collected data!

 A typical airliner, for example, travels at an altitude of about ten kilometres, and so the passengers and crew are exposed to more cosmic radiation than people on the ground since there is less atmosphere up there to absorb the radiation. The effective dose due to the cosmic radiation is about 2 microsieverts per hour. An around-the-world flight takes about 50 hours of flight time, so you would be exposed to about 100 extra microsieverts while you were in the air. This doesn’t really make much of a difference to an average person’s annual total. It’s about the same as a single chest X-ray.
However, flight crews do a lot more flying obviously than the average person, and they receive about 3,000 to 5,000 microsieverts per year inflight, that is over and above normal background radiation, that they would get anyway on the ground. However, there doesn’t seem to be any hard evidence that flight crews are getting more cancers than anyone else. They are still classed as “radiation workers” though and so their exposure to radiation is monitored.
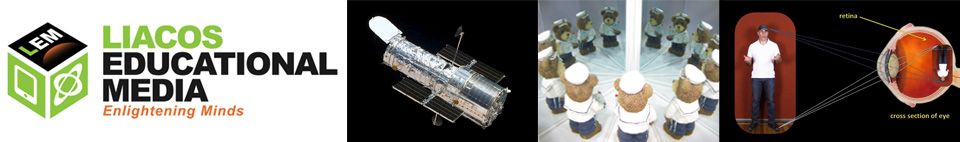
Now astronauts in space, above the atmosphere, are obviously not protected at all by the atmosphere (although there is a little protection from the Earth’s magnetic field), so they’re exposed to much higher levels of ionizing cosmic radiation. So, what effective dose to they receive and is it harmful? Well, in 1973 and 1974, NASA operated its first space station called Skylab. There were three crewed missions altogether each consisting of three astronauts.

 The third crew that occupied Skylab (pictured here), were in space for 84 days and they received about 30,000 microsieverts in total while they were up there. This is more than the 20,000 microsieverts per year that has been set as the limit for radiation workers on Earth. However, though this is a small sample, Jerry Carr died at the age of 88, 46 years after the mission, William Pogue died at the age of 84, 40 years after the mission, and at the time that we made this video in late 2024, Edward Gibson is aged 87 and is still alive. So, 30,000 microsieverts in 84 days didn’t seem to affect the astronauts, but, remember, this a small sample.
Since the 1970s, astronauts have spent much longer periods in space in various space stations. The effective dose they receive is about 140,000 microsieverts per year. Now these long space flights have been relatively recent, and the astronauts are still fairly young, but no obvious increase in cancer rates have been recorded as of late 2024. However, it’s still way too early to tell for sure, and their health will be monitored for a very long time.
![]()
 So far, it’s been fairly good news. However, when one of the nuclear reactors at Chernobyl in Ukraine exploded in 1986 and released large amounts of radioactive materials, 28 workers died from radiation sickness within the first three months of their exposure. They developed nausea, vomiting and other symptoms fairly quickly and so much damage was done that they were unable to recover. They all would have received upwards of several million microsieverts. However, many of the clean-up workers actually recovered from their radiation sickness and survived.
- Nausea
- Vomiting
- Diarrhea
- Headache
- Fever
- Dizziness and disorientation
- Weakness and fatigue
- Hair loss
- Skin burns (similar to severe sunburn)
Among the residents who were living in nearby towns, who received a much smaller effective dose of radiation, there was an overall huge increase in thyroid cancer especially among children, because iodine-131 is a very common by-product of nuclear fission and it’s also very easily absorbed into our bodies from contaminated milk or crops. It concentrates in a person’s thyroid and so it gives that person’s thyroid quite a large dose.
 There were also increases in leukemia, a cancer that affects your blood cells, and increases in the number of people who developed cataracts in the lenses of their eyes. The lenses are normally completely clear but cataracts are a clouding of the lenses that leads to blurry or to dim vision.
 It was huge disaster, which not only lead to many sicknesses and deaths but also, thanks to the radioactive fallout, made large areas of surrounding farmland unusable and forced thousands of people to evacuate their homes.
It’s believed, after extensive research over the past 100 years or so, that the risk of developing a fatal cancer from radiation exposure is about 0.005% per extra 1000 microsieverts of effective dose. This means that if 20,000 people each received an additional effective dose of one thousand microsieverts, we would expect one radiation-induced cancer death to occur in this group of the population.
![]() Now in 1945, during World War II, many residents of the cities of Hiroshima and Nagasaki in Japan also received several million microsieverts of radiation in a very short amount of time when an atomic bomb was dropped on each city by the US military. Thousands of people were killed instantly of course, by the actual blast, but many who survived the blast died of radiation sickness within a few months. Cancer rates also increased enormously.
Now in 1945, during World War II, many residents of the cities of Hiroshima and Nagasaki in Japan also received several million microsieverts of radiation in a very short amount of time when an atomic bomb was dropped on each city by the US military. Thousands of people were killed instantly of course, by the actual blast, but many who survived the blast died of radiation sickness within a few months. Cancer rates also increased enormously.
And finally, Alexander Litvinenko would have received a similar effective dose of several million microsieverts when he drank tea laced with alpha-emitting polonium-218, and this led to his death from radiation sickness just 22 days later.
So low doses of radiation don’t seem to cause any harm. Larger doses can lead to radiation sickness from which people can recover but also from which they have a higher chance of developing cancer in the following few years. Really high doses lead to radiation sickness that is so severe that exposed individuals never recover and pass away.
Now in our next episode, I’m going to show you the basics of how scientists actually calculate the equivalent dose and the effective dose if they know the absorbed dose that a person receives. See you then.
CREDITS:
Decay chain(4n+2, Uranium series).svg by User:Tosaka
https://commons.wikimedia.org/wiki/File:Decay_chain(4n%2B2,_Uranium_series).svg Creative Commons License
.svg)
Decay Chain of Actinium.svg by User:Tosaka
https://commons.wikimedia.org/wiki/File:Decay_Chain_of_Actinium.svg Creative Commons License
Decay Chain pictures by https://commons.wikimedia.org/wiki/User:BatesIsBack
https://en.wikipedia.org/wiki/File:Decay_Chain_Thorium.svg
“The Evolution of Medical Imaging for Cancer Care” by IAEAvideo.
https://youtu.be/EeZNhX0IqsY. Creative Commons License.
How Does a CT Scan Work? By NIBIB
https://youtu.be/l9swbAtRRbg?si=dA4zTyQzFydiAWKa. Creative Commons License.
“How radiopharmaceuticals help diagnose cancer and cardiovascular disease” by IAEA. https://youtu.be/mQjCTTKWOFU. Creative Commons License.
Airbus footage © Airbus/master films. Used with Permission. https://www.airbus.com/broadcastroom/
Some photos taken from the ARPANSA website: https://www.arpansa.gov.au/
© Commonwealth of Australia as represented by the Australian Radiation Protection and Nuclear Safety Agency (ARPANSA).